Le Tour de France Speed Spiral
Cycling is not rocket science.
-Jens Voigt, 17 time Tour de France finisher
by Jesse Belden and Aren Hellum. The 106th edition of the Tour de France began Saturday July 7, with 176 riders lining up to contest the crown jewel of cycling. This race of endurance covers thousands of miles parsed out over 3 weeks, with riders climbing dozens of high mountains, sprinting for finish lines at automobile speeds and leaving a fair bit of skin on the asphalt. Early editions of the event were more menagerie than majesty. Bicycles were not ancient, but they did all have wooden wheels, required dismounting to change gears and the organizers of the Tour mandated that riders repair their own bikes. One might expect the average speed of the race winner to have steadily increased over the century, given all of the technological, pharmacological and organizational changes that accompanied the evolution of the sport. Here, we track the winner’s average speed as a function of year on a polar plot:
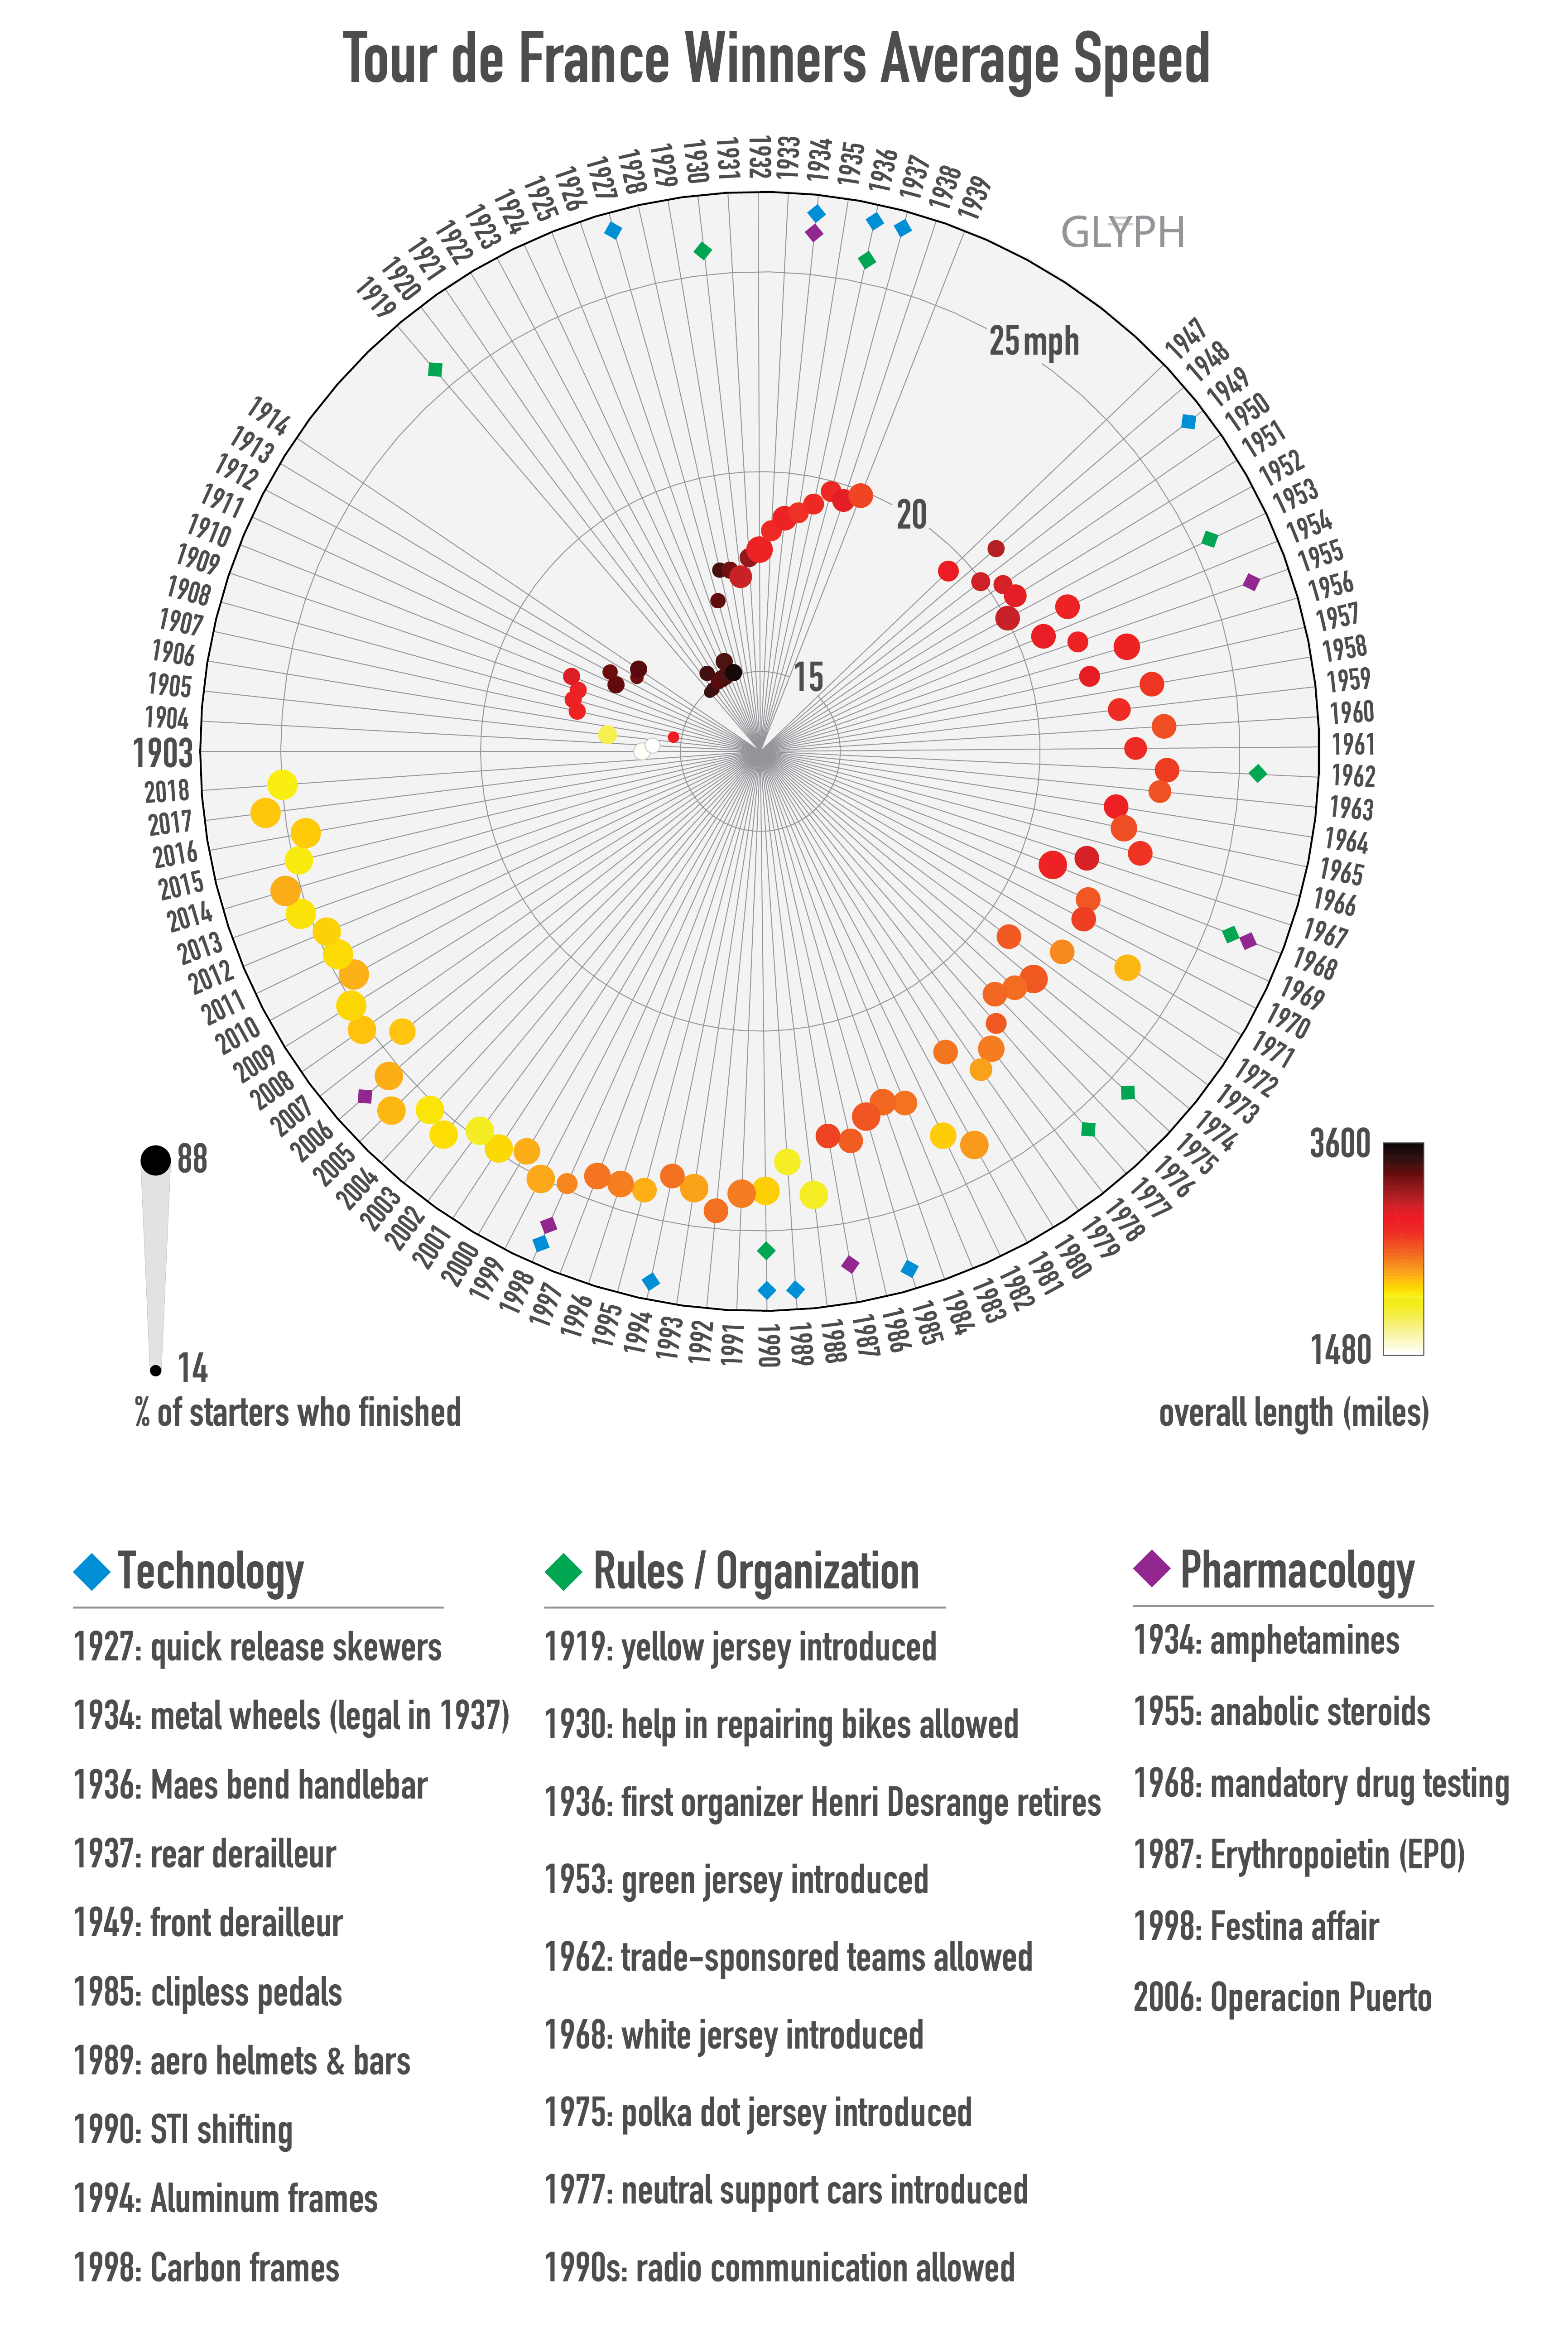
The angle axes correspond to the year and the radial axes map to average speed. The Tour de France has run annually since 1903, save for gaps for WWI (1915-1918) and WWII (1940-1946). Circular symbols mark speed, with the color mapping to the total length of each edition of the Tour and the size of the symbol indicating the percentage of riders who finished each year. Some tours, especially in the early days, we excruciatingly long and saw high rates of attrition; for example, the 1919 Tour de France was nearly 3500 miles long, including a 300 mile stage, and only 14% of those who started the race actually finished the entire Tour.
We’ve also marked some key technological, pharmacological and rule changes (colored diamonds) that seem relevant over the years (by no means an exhaustive list). Some highlights include: quick release wheel skewers, metal wheels, derailleurs and the allowance of help in mechanical repairs. These changes between 1927 and 1949 corresponded to a steady increase in the mean speed of the Tour winner. Although there is a modest average speed increase in the late 1980s / early 1990s coinciding with the years following the invention of synthetic EPO, the influence of modern performance enhancing drugs on average speed is perhaps more tempered than one would expect. Interestingly, the variance in speed of the winner since about 1990 is quite a bit lower than pre-1990. Nonetheless, the Tour de France is designed to test limits of human endurance and riders have been searching for ways to nudge these limits out since the event’s inception.
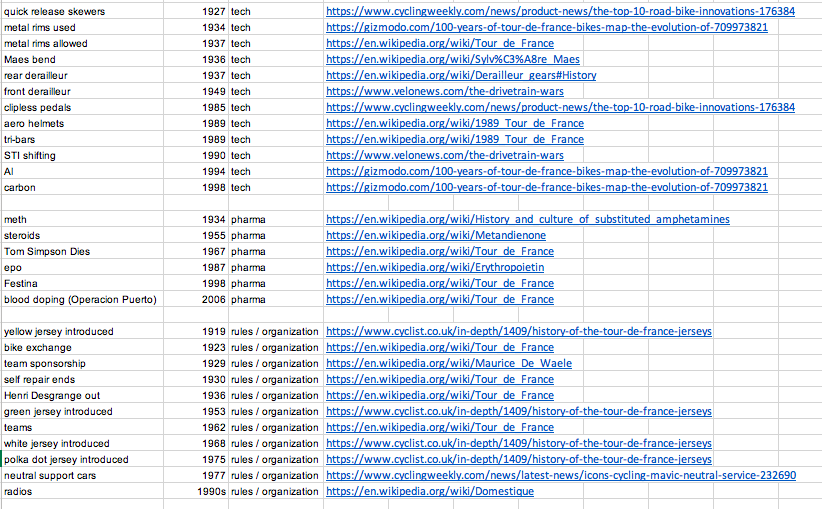
Sourcing for winner speed, length of Tour and percentage of finishers is from bikeraceinfo.com and stats.areppim.com. Sourcing for technology, rules/organization and pharmacology events are listed here:

1 Response
[…] like endurance things. 3000 miles on a bike? Yep. Ascending the height of Everest in your backyard? Awesome. Harvesting Emperor Penguins for […]