Why do banks offer mortgage points?
In a prior article, we showed that the payback time for a mortgage point for a common set of loan characteristics was around five years. Given that we were analyzing 30-year mortgages, perhaps the question to ask was not “Should you pay for mortgage points?”, but “Why do banks offer this?”. If you want to make as much as possible by loaning money to someone, it’s not a good bet on its face. One reason that a bank might do this is a competition with other banks; if a bank makes money by originating mortgages, it needs people to want to take out mortgages with them, instead of someone else. If some banks are offering to reduce interest rates in exchange for an upfront payment, other banks may be forced to do the same, even if they think that it’s a bad bet.
Another possibility (not exclusive from the first) is that they don’t think you’ll be in the house long enough for the points to pay for themselves. A 2016 industry report1 indicates that home tenure was around 10 years at that time, compared to a historical average between 6 and 7 years. Redfin’s more recent analysis2 estimates 13.2 years at present (and 12.1 in 2016). To pull from a non-industry source, a 2016 Census Bureau release3 states that 11% of Americans moved in that year, and the 2021 data 4 shows 8.3% of Americans moved. Assuming that homeowners move at the same rate as non-homeowners5 these movement rates predict home tenures of 9 and 12 years in 2016 and 2021. These estimates are all more than the ~5 years required (at current rates) to make the points a good bet for the bank.
Readers who can count to three will probably sense that I am building toward the hypothesis that I believe.6 Recall that you don’t have to switch houses for the bank to win this bet, you only have to switch loans. You also lose if you pay for the points and then the rate significantly drops. What is significant? To revisit our nomenclature from the last article, your original bet was that you could pay 1% of the loan value to reduce the base monthly interest rate  by
by  and that you would save money by doing that. Therefore, if the base rate drops below
  at some point in the future, you have been offered the same bet, assuming that the refinance cost is 1% of for outstanding principal. This is approximately right (1.29% national average in 2020), but it varies widely by state and region.7
How likely are you to be offered the same bet? Over the period from 1971-present, there’s about a 77% chance–see Figure 1:
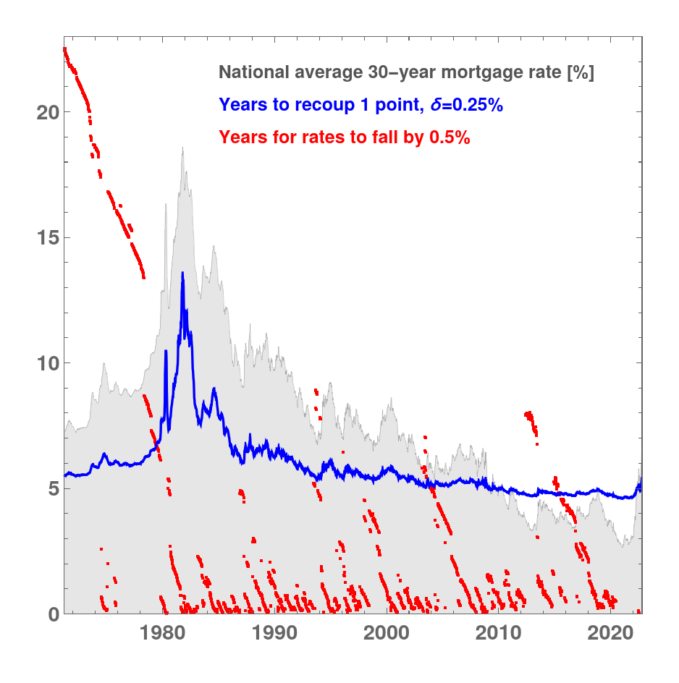
 (blue), years for rates to fall by
  (red). Data are from FRED8.
The gray curve is showing the average 30-year mortgage rate in the US, over the period Apr1971-Oct2022. The blue curve is the number of years required to recoup one mortgage point that you bought at . The red points are the number of years before the prevailing mortgage rate will offer you the same bet that you’ve already taken: below the point you’ve paid for. Red is below blue 77% of the time in this dataset, which is why I say that you’ll be offered the same bet 77% of the time before you have paid off that mortgage point. This is even more in the bank’s favor since 1980, coming in at 90%.
This at least partially explains why a bank would to offer to reduce interest rates in exchange for an upfront payment. Based on recent history, it is overwhelmingly likely that you will either (a) make that payment and still be paying a higher rate than the prevailing rate, or (b) make another upfront payment to get that new lower rate. Will this continue? With rates rising of late, it doesn’t look likely for the minimum (2.65% in Jan2021) to be surpassed soon, but a 40-year run will probably keep banks offering this bet for quite a while.
Questions or comments are best directed to @GlyphStory.
Featured image: Plot from present work, weird dice from Craiyon (query: “dice, style of Beksiński”), manipulation by Aren in Mathematica.
- 2016 NAR Profile of Home Buyers and Sellers
- Redfin estimate of homeowner tenure
- Americans Moving at Historically Low Rates
- 2021 Census Data on Geographic Mobility
- This seems unlikely to me–I would expect homeowners to be less likely to move. I think that this assumption is conservative, in that it will tend to reduce the number of years between moves.
- Those readers are astute philosopher kings/queens, who probably also read all the footnotes, and deserve every good thing that happens to them.
- Industry report on closing costs.
- 30-Year Fixed Rate Mortgage Average in the United States, accessed 23-Oct-2022.

1 Response
[…] 23-Oct-2022: Finished the followup article about refinancing. tl;dr: over the last 40 years, this was a good bet for the […]