On the increased drag due to broken Marlin bills
Jesse Belden and Aren Hellum
We like endurance things. 3000 miles on a bike? Yep. Ascending the height of Everest in your backyard? Awesome. Harvesting Emperor Penguins for their calorie density? Weird flex, but okay. Rowing a four person boat across the Atlantic? Absolut……. wait, what’s that now? It’s pretty typical for bipeds to balk at such a suggestion. What with the gigantic waves, sea sickness, interminable blackness, and headhunting Marlin.
Perhaps you’ve never heard of the Talisker Whiskey Atlantic Challenge rowing race that is presently unfolding. As if the proposition of rowing naked and sleeping in a broom closet isn’t ridiculous enough, try having your row boat impaled by a giant Blue Marlin with a three foot sword on its nose. Although the spear did miss the leg of a Team Latitude 35 oarsman by a couple inches, it penetrated well into the boat. The team was also left with about 3 inches of bill sticking out of the boat into the water. While that seems like a small remnant from such a medieval battle, that little stub has the potential to add a not insignificant amount of drag to the boat. How much? Let’s take a stab1…
The power balance for a rowing craft is

where  is the useful power produced by the rowers,
  is the density of seawater,
  is the speed over ground of the boat,
  is the speed of the current relative to ground, and the product
  is the drag area of the boat.
Because the race duration is long, we can assume that the power produced by the rowers is approximately fixed 2, such that

where the terms  and
and  are the change in velocity relative to water and change in drag caused by a 400 lb. sea monster jamming its fucking face through the hull.
We can estimate some of these quantities.
-
 watts. 3 We could estimate this better using the cited reference if we had an ergometer data point from any of the Latitude 35 athletes. *makes phone hand gesture* *mouths “…call me…”*
 -
 , from the recorded position of the boat, recorded prior to impact.
 -
 m/s. This is the notional average value for the North Equatorial Current.
Now we can solve Eq.1 for the unknown term, yielding  . As noted before, this is a “drag area”, meaning that we’re lumping the characteristic area of the boat in with its dimensionless drag coefficient. This is the drag area of the boat, prior to the marlin impact. Sometimes there is a compelling reason to separate these terms. For example, if you have two objects with the same shape but different sizes, you can assume that they might have the same drag coefficient
  , but a different area
  , and you might be able to guess the drag coefficient. Boats are tricky, because their characteristic area is related to a number of different geometric parameters as well as their loading, sea state, etc. This is why we left this as the unknown in Eq.1.
In contrast, we can estimate for the busted marlin bill pretty easily. From images, the protruding part appears to be about  inches long and
  inches in diameter, giving a frontal area
  . Using limiting values for slender and squat cylinders 4 we get
  , such that
  .
.
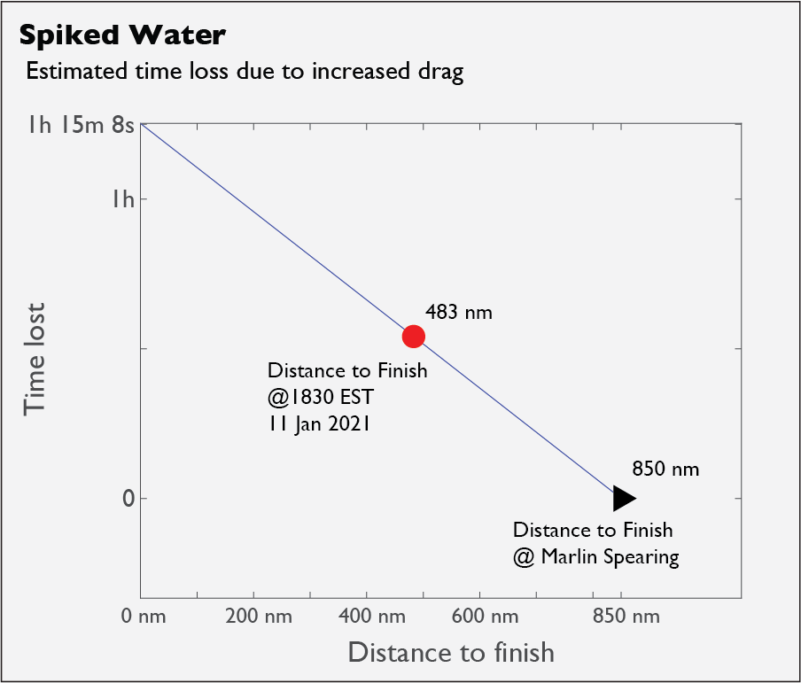
We can now solve Eq.2 for the change in velocity, yielding  . This…is not large, but there are a lot of seconds in this kind of race. Per the team’s interview on The Move podcast, the impact occurred at
  nautical miles (nm) from the end of the race. We can use this to compute how much total time the Lat35 crew will lose because of the marlin bill’s drag

This time loss varies linearly with the distance to the finish (DTF), and the DTF at the time of writing is 483 nm. Thus, at the time of writing the crew has lost a little over 32 minutes, due to lose another 43 because of the added drag. That’s not an enormous amount of time in a 30-plus day race, but it would have made differences in the leaderboard in the 2019 edition. Let’s hope that twice fucked by Marlin bill doesn’t become a term of art for rowers.
Photo credit for Marlin photograph on featured image: NOAA – Gardieff S. (2003). Atlantic Blue Marlin. Florida Museum of Natural History (this page on web archive., Public Domain, https://commons.wikimedia.org/w/index.php?curid=6011754