Enter the Death Cross.
Can the stock market be timed? If what you mean by that is, “Is it possible to intelligently manage my equity exposure by carefully studying a large number of fundamental corporate and macro inputs, then adjusting my risk profile in accordance with those variables and my investment thesis?” Yep! I mean probably. Also, now you’re managing a mutual fund. Also, most of them f*ck it up, net of fees. So it’s a hard maybe.
If what you mean is, “Is there a perfect, easy-to-compute indicator that will tell me to sell my stocks, and then buy them back at a lower price?” I…can’t prove it’s impossible? One candidate strategy that gets floated when people get nervous about the stock market is to look for the so-called “death cross”. The idea of the strategy is that when some short-term moving average falls below some long-term moving average, you sell. When that same short-term average goes above the long-term average, repurchase. This re-crossing is typically referred to as the “golden cross”. I wanted to title this article, “You shall not crucify your stock market gains on a cross of gold!”, but I was informed that this title was (a) too long and (b) has not been a timely reference for a while now.
The Internet was thick with articles and forum posts on the topic when the market was dropping in late 2018. Although there’s not a lot of real analysis going on with the articles you see, you can talk yourself into thinking it might not be total bullshit. Over some long timescale, the market is probably rational. Over shorter timescales, maybe not. You sometimes see this described as the market being a weighing machine over a long interval, but a voting machine over a short one.1This quote is typically attributed to Benjamin Graham, but never with a with a source document attached. One hypothesis is that he said while teaching class at Columbia and one of the students spread it around with his name on it. So maybe it’s not crazy to think that maybe there’s a way to sell before it gets too bad and repurchase near the bottom.
Going three rounds with straw men. Let’s first show a successful example in the context of the Great Recession, using 200 days and 50 days as the long and short averages.
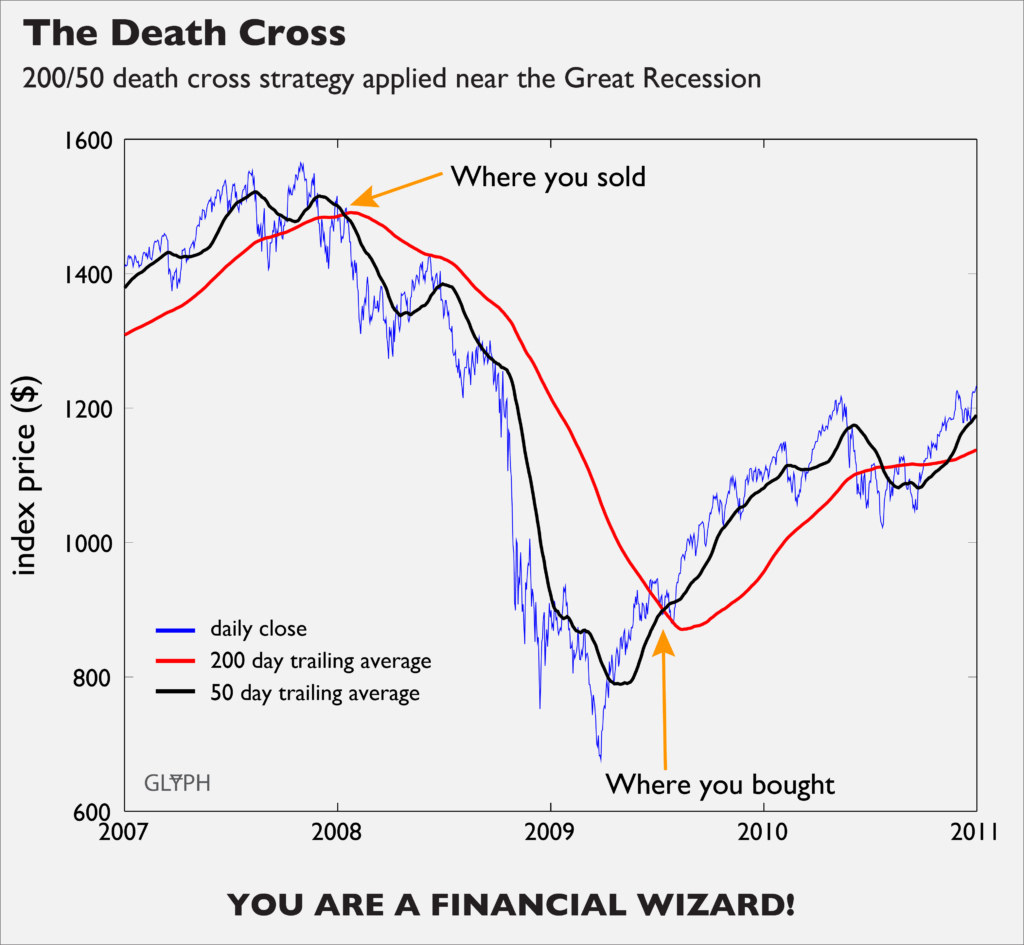
So that seems good. You sold after the peak, but you missed the worst of it. You also missed buying at the absolute bottom, but got back in before it really took off. On the right side of the plot in late 2010, you can see a foreshadowing of potential problems. First, repeated swings can cause you to trade on what is basically noise. Second, consider that you don’t get to sell or buy at the price where the averages cross, you have to buy at the actual price. In 2008, these were pretty close, but there might be a gap, as there is at both buy and sell in 2010. You would have lost money on that sequence of buy and sell decisions.
Here’s a really dramatic illustration of some of the problems around the Black Monday crash in 1987:
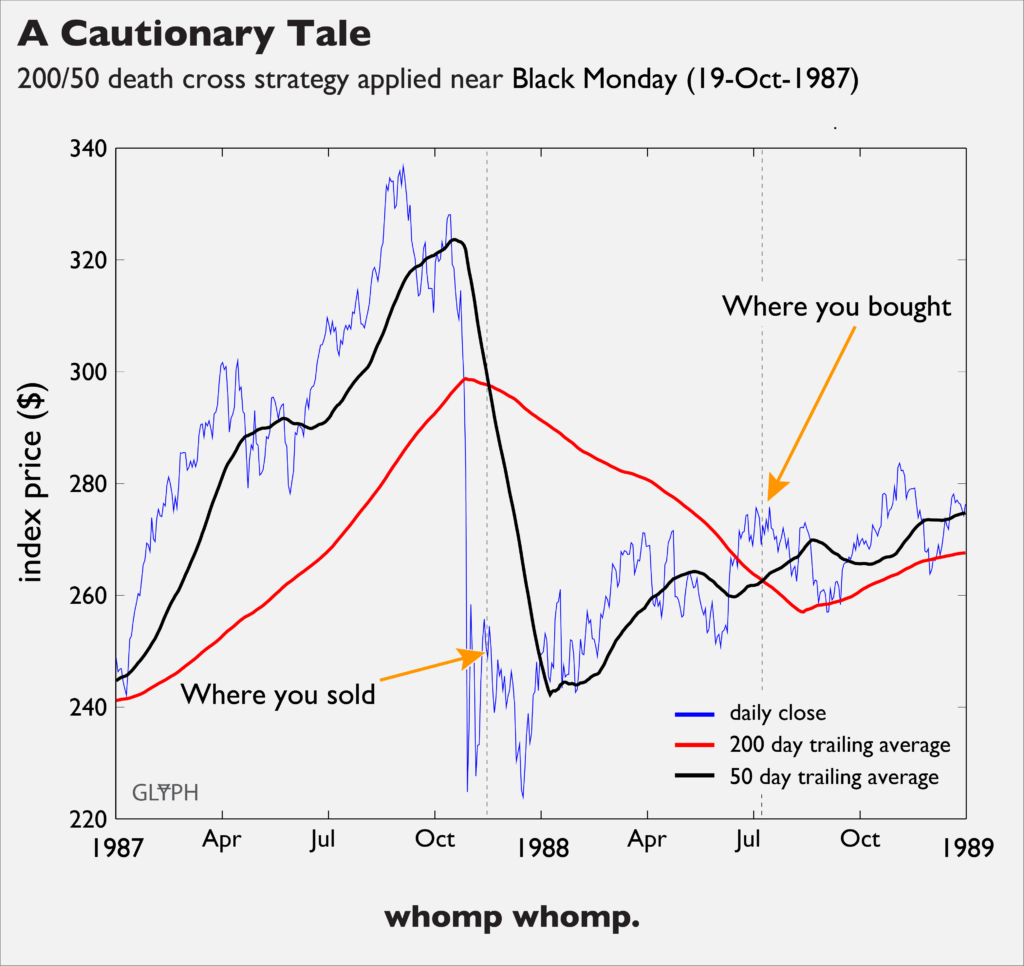
This is a really extreme example but serves to illustrate the point: trailing averages can’t react to fast changes. Now, it seems reasonable to say that of course you wouldn’t sell way after a dip like that, it was obviously a one-time thing and you would have taken the loss and bought in afterward and then you would have done a bunch of coke with the Mets because YOU’RE AN 80’S GUY!2Sorry about the boneitis.
Okay, but no. You’re reading stock market analysis written by some Internet dingus (me). It’s equally likely that you would have sold at the close of Black Monday, re-bought on a short upswing, shit your pants when it dropped again, sold, repeat until broke. So in some sense, a disciplined averaging strategy might be good if it prevents you from doing something even dumber.
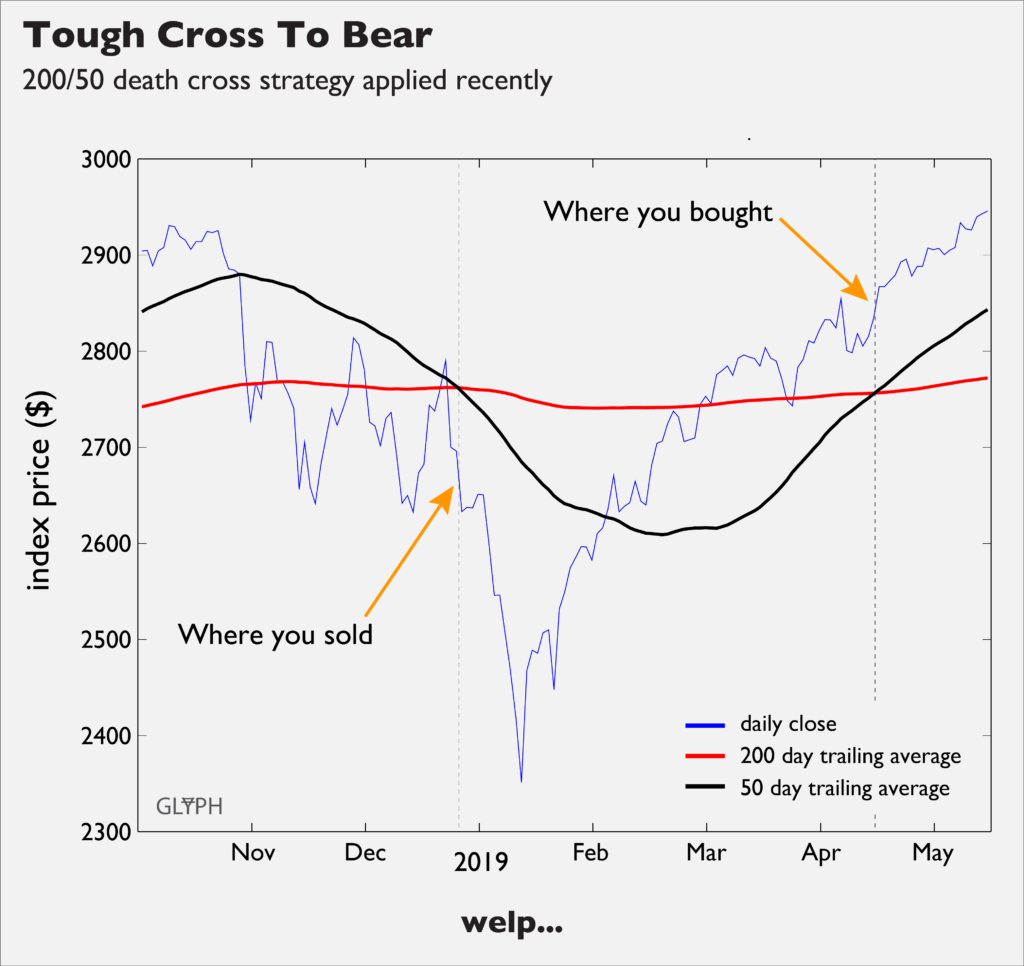
What about recently? This article indicated that the market was about to be engulfed (!) by a key (!!!) 200/50 deathcross in mid/late December 2018. It did cross. It has now crossed back. The strategy lost money.
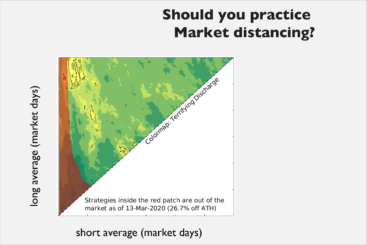
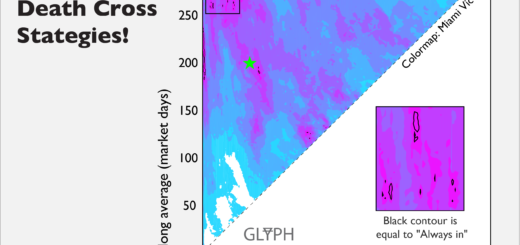
This is the part where you, the savvy consumer of data-based journalism, protests that I am using a single set of long and short averages. Furthermore, there are some notable failures shown, but that doesn’t necessarily invalidate the strategy if it works more than it fails. Is there some set of averages which would have improved upon the market returns over the market’s history? These are good questions! Next in this series, I provide receipts. I hope you like contour maps.