143 years of screwing up: a historical look at errors in baseball
(a) The official scorer shall charge an error against any fielder:
From the official rules of Major League Baseball, Rule 10.12 (Errors)
(1) whose misplay (fumble, muff or wild throw) prolongs the time at bat of a batter, prolongs the presence on the bases of a runner or permits a runner to advance one or more bases…
Rule 10.12 has a lot more to say about edge cases of what should and should not be scored an error, but the gist of it is right there in (a)(1): a fielder does a thing and we score the play as something other than an honest hit. There are some obvious cases, but one issue with the rule is that “misplay” is doing a lot of work. If an outfielder takes an aggressively terrible route to a catchable fly ball, is it an error? The rulebook clarifies this:
If […], in the scorer’s judgment, the fielder could have handled the ball with ordinary effort, the official scorer shall charge such fielder with an error.
Official comment: Rule 10.12(a)(1)
…by substituting the as-vague-but-different “ordinary effort”. I appreciate that it’s a hard problem. If you judge ordinary effort to be things that ordinary people would do if they were spontaneously recruited to play third for the Dodgers, nothing short of cowering in the fetal position is going to be considered an error. An official scorer who watches Andrelton Simmons a lot might have a skewed perception of what plays are makeable. Knocking a liner down but not being able to make a play with it is more subject to the scorer’s whimsy than getting the same jump on the ball and missing it entirely.
I’m not breaking any new ground here1 2 3, but keeping track of errors alters our perceptions of players in a few ways. Most obvious is the tendency to view fielders who make lots of errors as bad. This is natural, since there is a stat that might as well be named “you fucked up”, and so we see the guy with lots of them as worse. All things being equal, less errors is preferable to more errors, but a fielder that gets to fewer balls will tend to record fewer errors. This isn’t obvious from the text of the rules, since the scorer officially has broad latitude to determine insufficient effort to be an error, but it’s not common. Newer fielding statistics 4 5 6 account for this by attempting to establish fielder range in various ways.
Errors also change our perception of pitchers. The “earned” in Earned Run Average refers to runs that were not tied in some way to an error. There are ways of decoupling pitcher performance from fielding which are less crude 7 8 9 than only removing errors. Finally, a hitter who reaches on an error is credited with a hitless at bat, reducing both their batting average and on-base percentage. It’s not obvious that this would cause a bias against one type of hitter, but it is a little odd to draw such a sharp distinction between hitting a ball that was not possible to field and one which was merely so difficult to field as to cross up a professional.
In 2019, about 1.5% of plate appearances involved an error of some kind, or a little more than one per game between both teams. The error isn’t tremendously rare, but it’s not one of the three most important things to know about a game, like a line score would indicate. In baseball’s early days, it was a little more important, as shown in Fig.1, below.
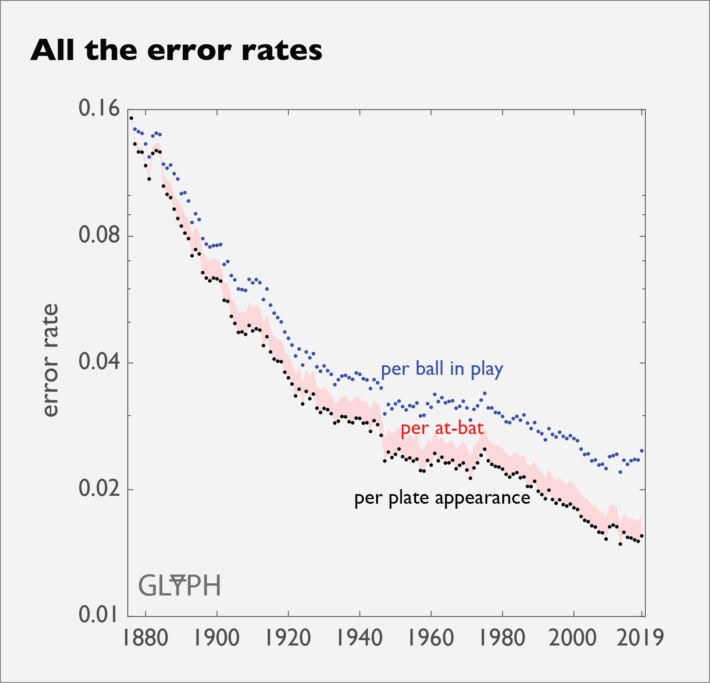
The three curves are the rate at which errors occur, but each has a different denominator. Errors per plate appearance (PA) is probably the closest to your impression of how often an error happens. A plate appearance has more than one opportunity (“chance”) for an error to occur–the shortstop can boot the grounder or overthrow the first baseman, and the first baseman can stonehand a good throw. Typically, the ball is in play for less time than the hitter is at the plate, so per PA rather per chance best approximates the time fraction of a game affected by an error.
Per at-bat (AB) tracks the per PA line pretty closely throughout history, coming to about 1.7% in 2019. The only reason to call out at-bats as a denominator is that an error is frequently scored as a hitless at bat.11 If errors were not distinguished from hits, this would have added about 17 points of batting/on-base average to the league in 2019. When the NL started in 1876, it would have added about 150 points, which goes a long way toward explaining why an old-timey scorekeeper would want to adjust hitting and pitching statistics to account for errors.
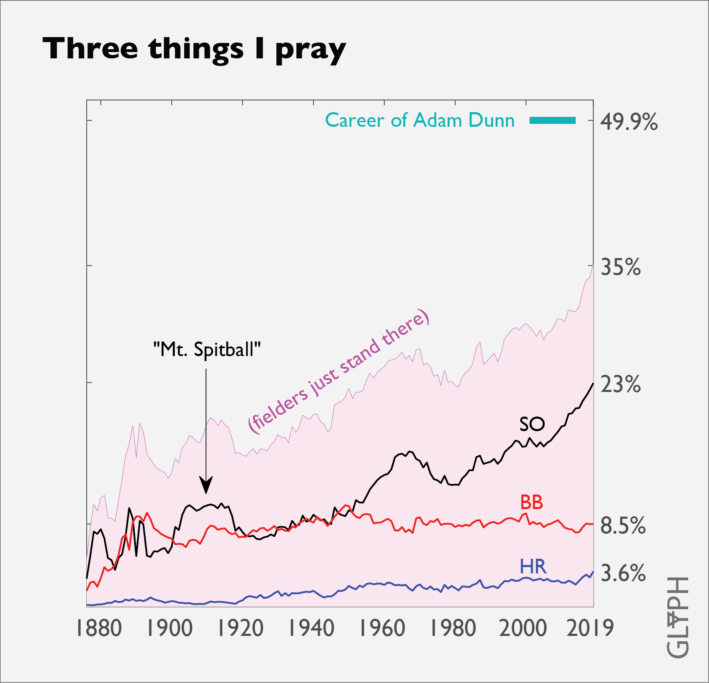
Per ball-in-play (BIP) removes from the denominator the at bats where the hitter either strikes out (SO), walks (BB), or hits a home run (HR). Each of these events is largely immune to fielding shenanigans, so they are typically called the “three true outcomes”. Increasing frequency of the three true outcomes, driven largely by increasing strikeout rates (Fig.2), is why the errors-per-PA is decreasing more rapidly than errors-per-BIP.
What is useful about BIP as a denominator for the error rate is that it better approximates the change in fielder skill over time by removing trends better associated with the changing approach of the pitcher and hitter. Once you remove the three true outcomes, you can do an adequate job of reducing the history of error rate into two trends, shown in Fig.3.
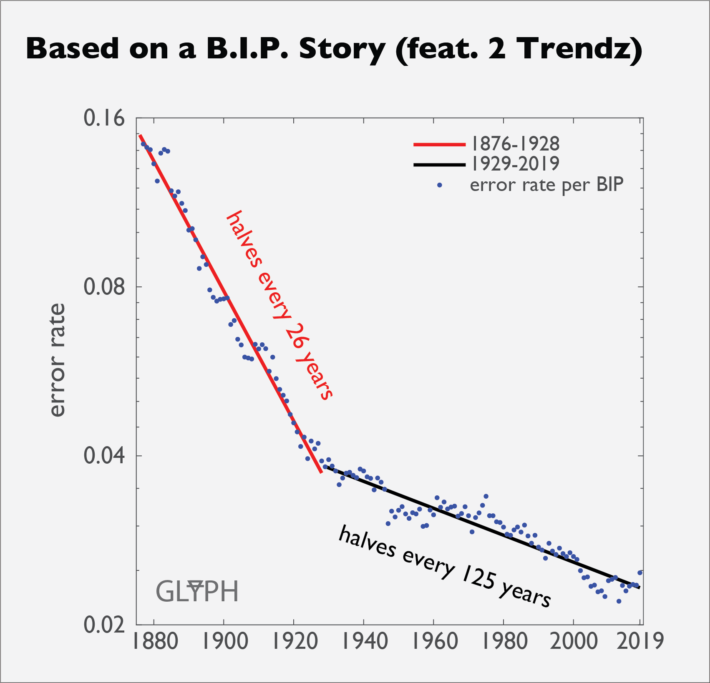
The first trend runs from 1876 to about 1928 and saw the error rate halve every 26 years. Now, there is a LOT going on over that time period: fielders start using gloves, the rise and fall of the spitball, multiple major leagues appear (most didn’t make it), the mound moves from 45 to 50 to 60 feet, improvement and standardization of the playing surface and equipment, etc. It’s not obvious that these changes would be described well by a single line on a log plot, and to be fair, there are a lot of dips and dives around that trend.
I suspect the change in trend is also driven by the process of consolidating the best white baseball players in the country into the major leagues. This is in part because the kink in the curve comes in the late 1920’s, whereas the above changes to the game had generally wrapped up by that time. In 1922, the Supreme Court granted Major League Baseball a bullshit12 exemption to the Sherman Antitrust Act. Among other things, the ruling allowed the MLB to pillage the then-independent minor leagues.
The largest anomaly in the second (slower) trend is the massive drop from 1946-1947. The major catalyst for the one year drop is probably returning veterans from World War Two, but notice that error rates are below trend throughout the 1950’s. I would guess that this is the effect of gradually replacing the league’s most borderline players with Negro League All-Stars. I also like my wife’s theory, which brings us back to the beginning a bit. Calling an error is an inherently pessimistic act–that ball wasn’t really a hit, it’s just that someone else messed up. Everyone sucks here, let’s go drink furniture polish because the fucking Volstead Act has some run left, and 25% of America is unemployed. What if scorers in the 1950’s were just feeling a little too good about everything to call as many errors? America just won a war, everything is booming, and maybe Teddy Ballgame just hit that ball too hard for anyone–even Scooter–to catch up to it.
I’m hoping to dig into the shorter-run anomalies, disparate impact on different types of hitters and pitchers, and park effects in later installments, but it’s useful to first establish the bigger trends.
Photo credit for Adam Dunn photograph on featured image: Wknight94 / CC BY-SA (http://creativecommons.org/licenses/by-sa/3.0/). https://upload.wikimedia.org/wikipedia/commons/f/f5/Adam_Dunn_08.jpg
- https://blogs.fangraphs.com/the-error-of-the-reached-on-error/
- https://joeposnanski.substack.com/p/judgmental-stats-batting-average
- https://www.newyorker.com/sports/sporting-scene/the-error-in-baseball-and-the-moral-dimension-to-american-life
- https://library.fangraphs.com/defense/inside-edge-fielding/
- https://www.baseball-reference.com/about/total_zone.shtml
- https://en.wikipedia.org/wiki/Range_factor
- http://m.mlb.com/glossary/advanced-stats/fielding-independent-pitching
- https://library.fangraphs.com/pitching/xfip/
- https://library.fangraphs.com/pitching/siera/
- https://www.baseball-reference.com/leagues/MLB/field.shtml
- Not always, of course. There are some cases where everyone would have been safe, but there is an extra base taken because of an error, or an error on a foul ball, etc. My plan is to get more granular about whether this used to be more common in another installment.
- I am not a lawyer.